Shelfware

ShelfIf you hang around various IT departments long enough, you are bound to run into “shelfware“. That’s the term used to describe software that is purchased, but is either never used, or used for a brief period and then forgotten. Ask yourself this. Why would a company spend money on software and never use it? The answer can vary, but in my experience, it generally happens because the IT staff is too busy to give it the proper attention it needs.

Let’s face it. Your average corporate IT staff is overworked and understaffed. There is always more work than there are bodies to cover the workload. In my opinion, that’s the main reason so many IT people move between companies on a fairly regular basis. Burnout.

Then, there’s the problem of finding qualified people to perform the work. Maybe it is due to companies not wanting to invest in training their people or maybe demand is greater than the supply of talent out there.

One of the major pain points I have noticed in the past several years has been visibility within the network and the systems and applications that run on it. This is not as big a problem in larger environments where the IT staff and budgets are at a decent level. In the small and medium environments, visibility tends to be poor.

Why Is Visibility Needed?

Networks are infinitely more complex these days. I remember when I first got involved with IT in the mid-90’s. Everything was simplified when compared to today. An application was typically tied to a couple of servers and all the end users had some local piece of software installed that interfaced with these servers. Web services were in their infancy.

Fast forward to 2013. Web based applications dominate most of the environments I do work in. These applications are typically multi-tiered where a web server talks to application servers, and those application servers talk to a bunch of database servers. Load balancers are sending client requests to servers based on any number of factors. Complexity always seems to be going up and never down.

If you get into an environment with limited visibility into the network and applications, it isn’t a pretty sight when things stop working. Conference calls and meetings are spun up and everyone scurries about checking their various areas of responsibility to try and find the culprit.

APM To The Rescue!

Application Performance Management has become essential for so many networks out there in recent years. It isn’t enough to know if all your servers are up and running. The days of pinging a box and marking it as good are over. Often times, there are numerous things that have to be checked on each server, be it web, application, or database, just to determine whether or not it is healthy and can serve clients. The APM systems out there that give you insight into the problem cause can be equally as complex as the application you are trying to monitor.

Let’s say that you run a simplified APM system like ExtraHop, which I wrote about here, that doesn’t require software agents on servers and uses packet captures to determine application health. You still have to have someone who can look at the data it presents and interpret that correctly to solve the problem.

Maybe your company has someone or a group who has the sole task of managing the various monitoring systems. I was in one of those environments several years ago, and that person was a very valuable resource. What if you don’t have that person or persons dedicated to watching monitoring systems? What then? That’s where software tends to end up as shelfware. It’s running. It’s watching various things, but generally only gets looked at when there is a problem. When there is a problem, hopefully you have someone on the IT staff that knows enough about your applications to make an intelligent guess as to what the problem is. If you don’t, there is an alternative.

Introducing Atlas Services

While at the Interop Las Vegas show in May of this year, I spent some time talking with ExtraHop about their Atlas service. I work for an ExtraHop reseller and wanted to learn more about this particular offering.

In an effort to take some of the difficulty out of APM, ExtraHop offers a managed service called Atlas. The concept is pretty simple. You drop in one or more ExtraHop appliances(physical or virtual), feed it the appropriate network data and they take care of the rest. In a non-Atlas deployment, you have the same appliances(all commodity Dell hardware for the physical boxes), but are left to your own to configure it and interpret the data.

With Atlas, engineers at ExtraHop review the data they capture from your network and build reports showing you where actual problems are. The longer they perform this service for customers, the more data they have to make even better recommendations as to how your network or systems should be configured. I liken this to security vendors that get data from their customer base and use it to create better signatures or methods to prevent exploits from bypassing their hardware and software. At some point, ExtraHop might be able to automate this process because they have seen a particular issue show up thousands or millions of times.

Here is a sample report from Atlas:

The link to the actual report is here.

What’s The Value?

There are a few things I can think of where a managed APM service like this helps.

First, you don’t necessarily have to employ an APM dedicated resource. They can use their expertise to provide you a level of knowledge and service as if you had someone who solely focused on APM on staff. This moves you closer to being proactive as opposed to reactive.

Second, it frees up your overworked IT staff to focus on other things. A lot of times when I am doing work for a client in a consultant capacity, it isn’t because I am more capable than the in house IT staff. It is because they have too much to do and just need to offload some work to a third party.

Closing Thoughts

APM is not easy. Implementation can be difficult and being able to get the maximum value out of the product tends to be a challenge without a dedicated resource tending to it. The Atlas service from ExtraHop is an attempt to take the headache out of APM. Their product is already easy to use without the Atlas Service:

Shelfware as a whole is probably not going to go away. However, with an offering like Atlas from ExtraHop, there is no need for your APM solution to not give you as much value as it can and end up collecting dust.

You can check out more about ExtraHop at www.extrahop.com.

Posted in extrahop, monitoring, network management | Comments Off on Shelfware

A Different Way To Understand RF

I came across this article tonight which shows a proof of concept system that can allow you to control devices in your home based on body movement and gestures that are detected by wireless client devices working in conjunction with wireless access points. The main project site is found here and is called WiSee. Here is the video showing the technology:


This is a really neat idea! As I was watching the video, I couldn’t help but remember a presentation I was fortunate enough to attend at Ruckus Wireless’ headquarters as part of Wireless Field Day 2 in January of 2012. Victor Shtrom and GT Hill gave a presentation on the RF side of wireless that was fantastic. I highly recommend watching the ENTIRE presentation, but I wanted to point out a specific part of the presentation where Victor talks about how our movements around a room affect the RF pattern. His presentation helped me wrap my head around the RF side of Wi-Fi in a way that nothing else ever did. Configuring hardware for Wi-Fi is one thing. It is an entirely different thing to actually understand the RF aspect.

The link to the part of the presentation I wanted to focus on is here. Or, if you want to watch the entire presentation, it is shown below. The part to focus on begins at 4:19.


I hope it helps you as much as it did me in terms of understanding the physical layer aspect of Wi-Fi!

Posted in learning, ruckus, wireless | Comments Off on A Different Way To Understand RF

Another Big Shiny Switch

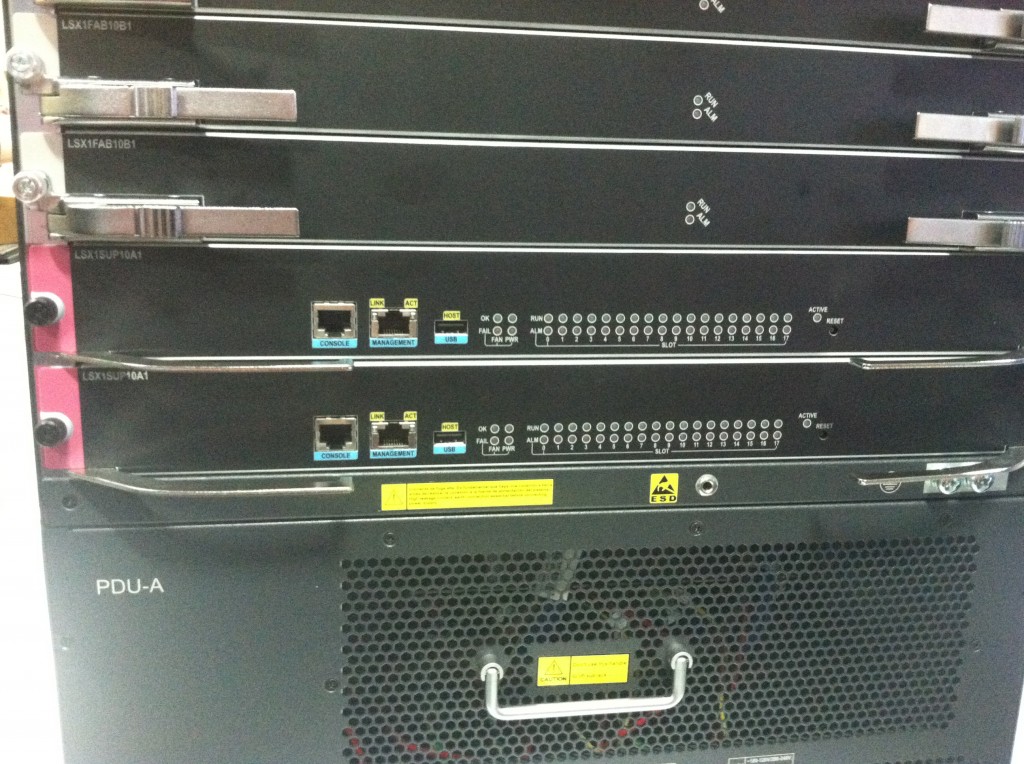
At the Interop Las Vegas show in May, I got an up close look at the new HP12910 switch. I thought I would post some pictures I took and give my take on this new platform. First, I should point out that this is the smaller of 2 new switches from HP. There is a larger 16 slot switch that was not on display in HP’s booth at Interop. Second, these new 12900’s were brought over with the 3Com acquisition. They are not brand new HP designs, not that it really matters.

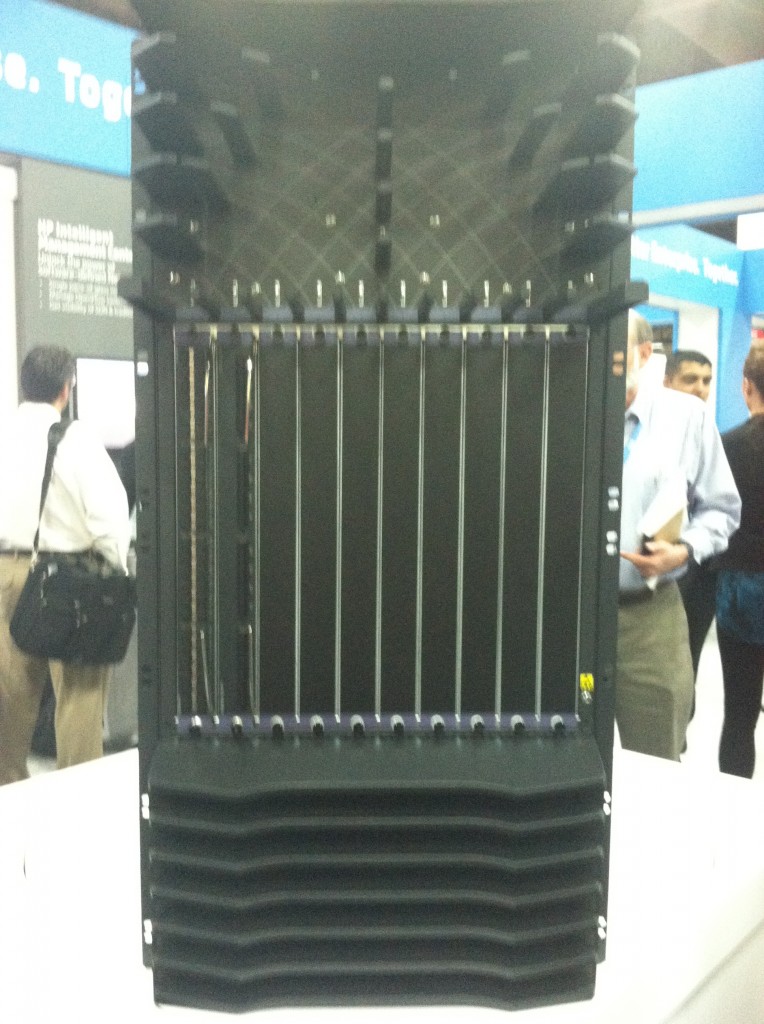
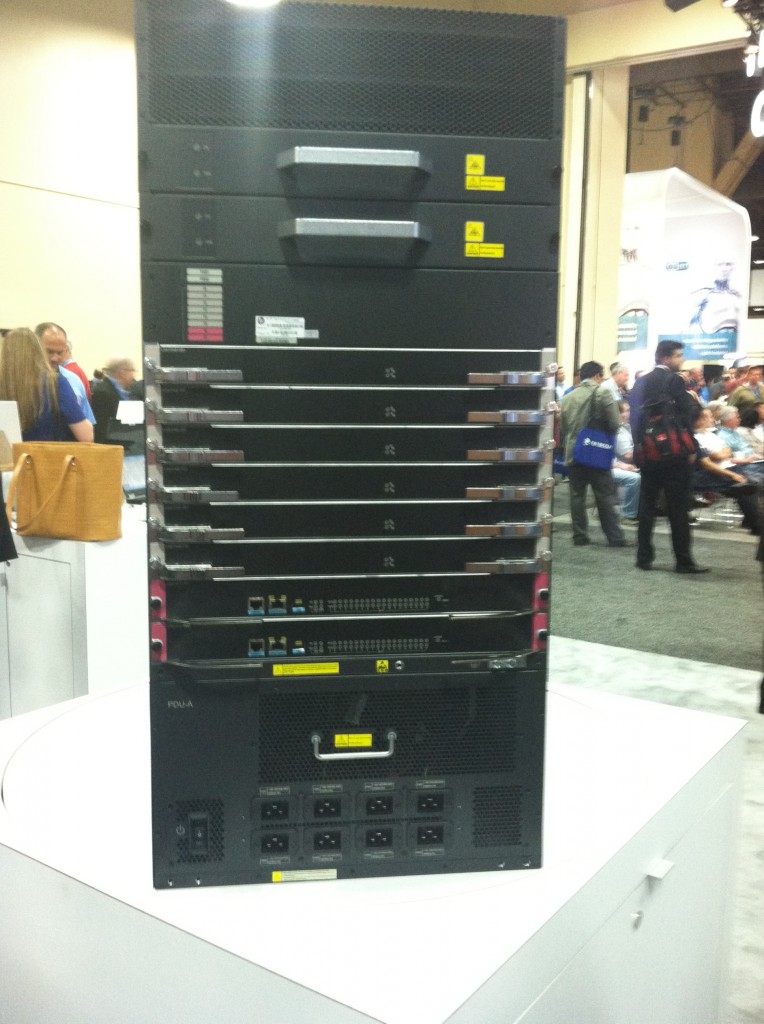
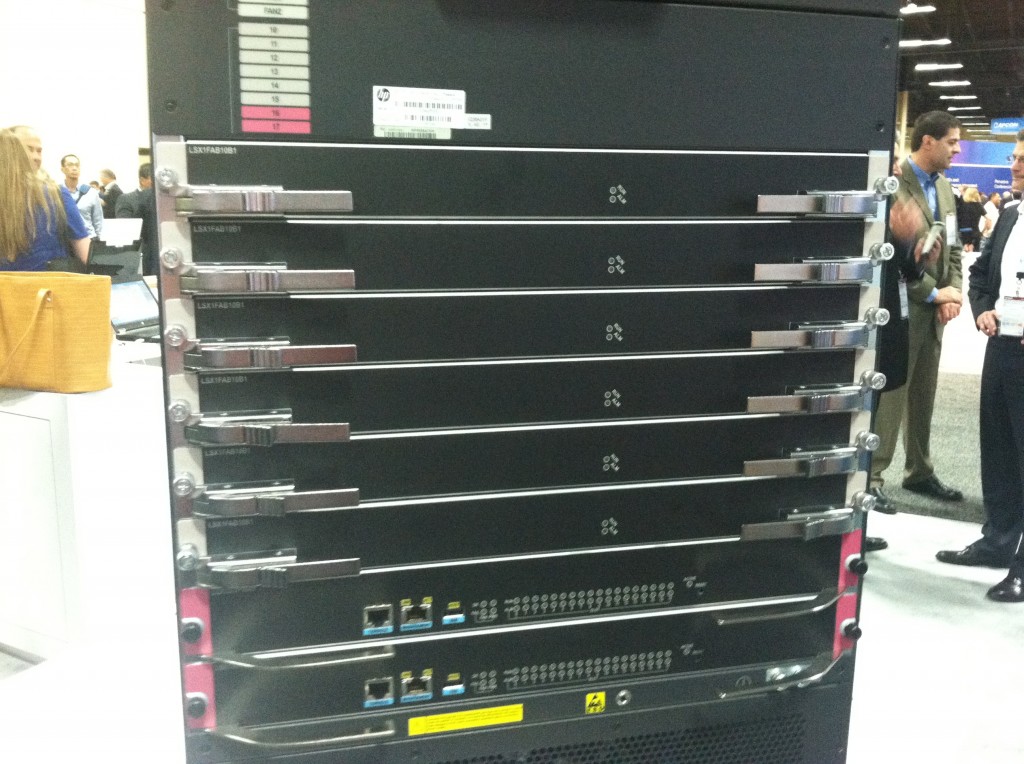
At first glance, one might look at the 12910 or 12916 and think they are Cisco Nexus 7000 clones. Looking at the 12910, you can see the physical resemblance to the Nexus 7010. Upon closer inspection, the platform itself is a bit different. There are actually 10 slots for line cards. The supervisors are located in the rear of the chassis. In actuality, it is a 12 slot chassis. There are also 6 fabric modules instead of 5 on the Nexus 7010. I could go on, but let me just show you the up close pictures and comment on each one. I should also point out that I may be completely wrong in some of my comments. This is a new chassis and other than a spec sheet, not much information is available. I suspect that will change in the near future.

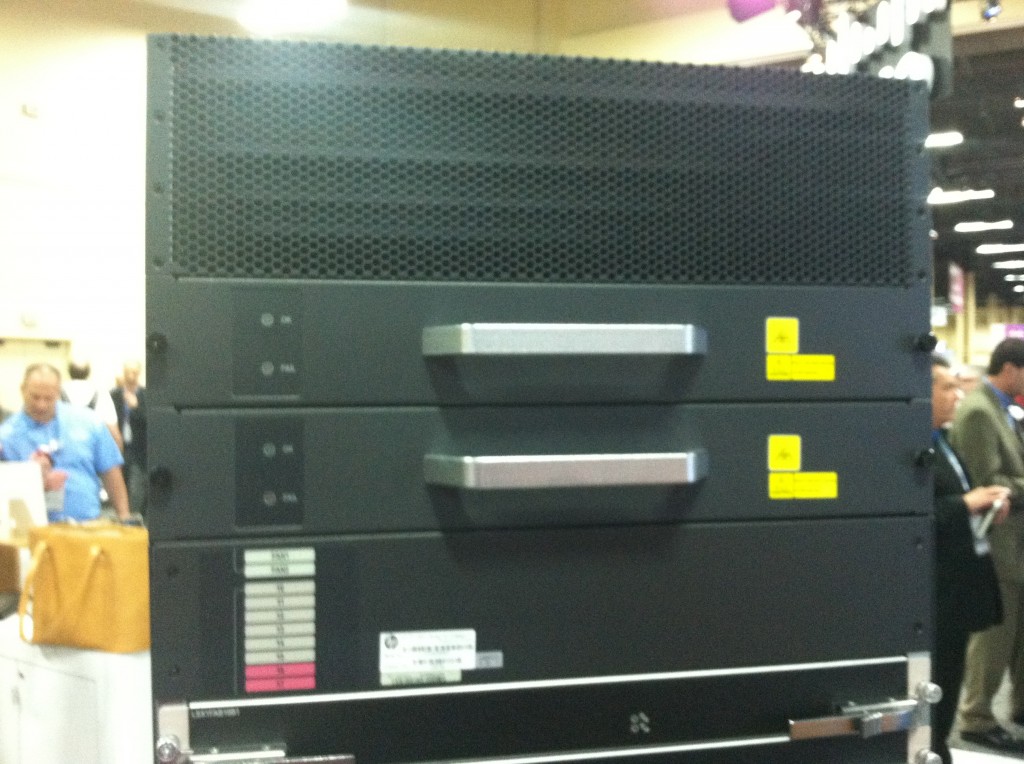
12910 Front View

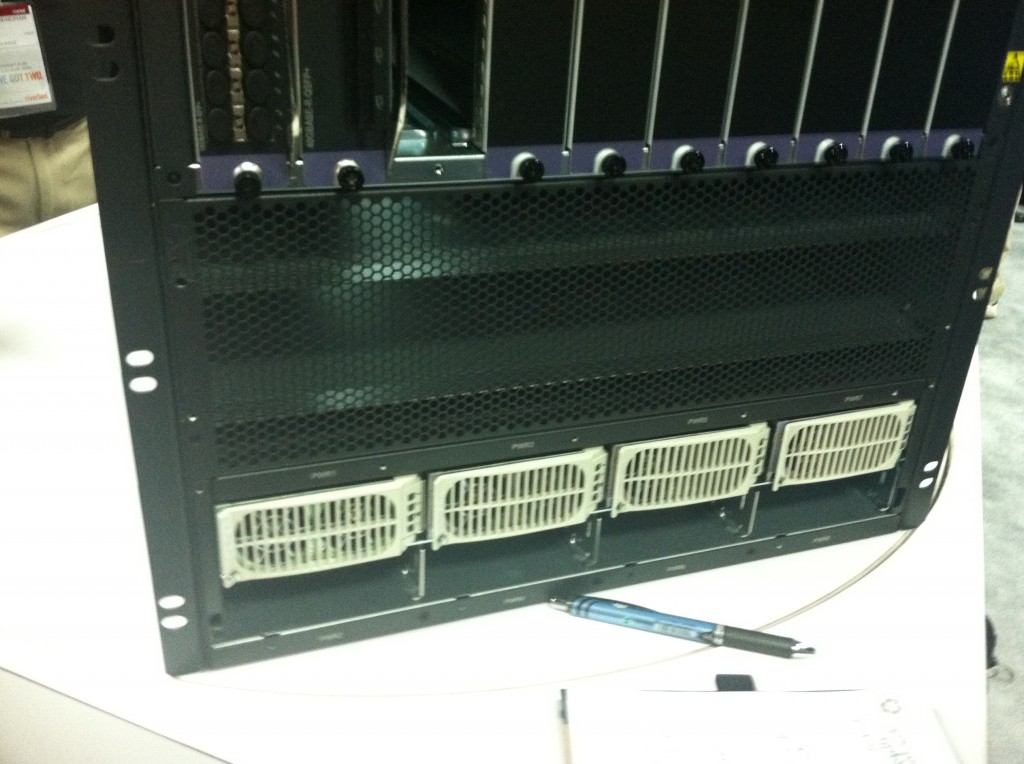
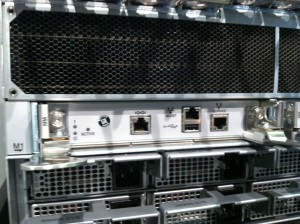
Notice the cable management at the top of the chassis. Also, the bottom portion below the line cards appears to be for air intake. This is a front to back airflow chassis. I was able to remove the bottom cover and it looks like this:

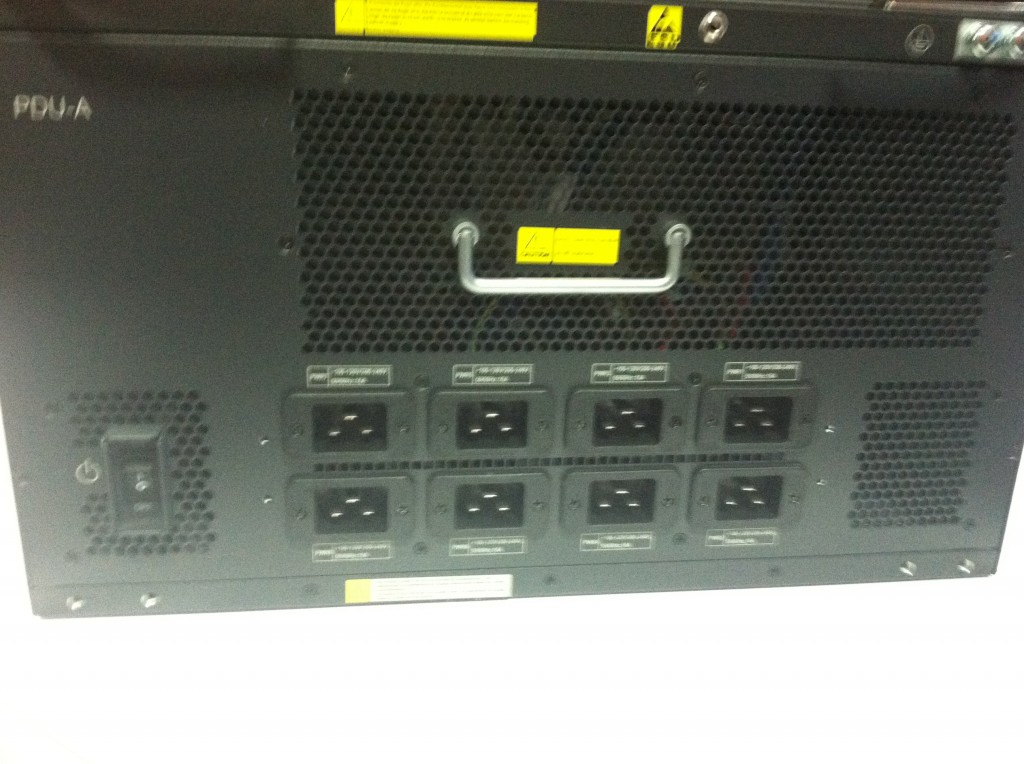
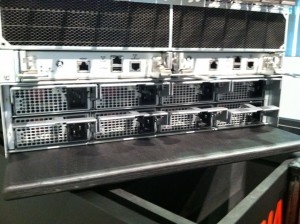
12910 Power SuppliesYou can see that only the top portion of this is for air intake. The bottom portion is where the 4 power supplies are housed. These are hot swappable of course, but the difference is that there are no spots to plug in a traditional power cord. That happens in the back where there is a PDU(Power Distribution Unit). It looks like this:

12910 Rear PDUA different way to break out power compared to most chassis I see. I’m not saying it is a bad design as I am not a power expert by any means. Just another way to do it. I do like the fact that you plug the cables into the rear of the chassis. A bit cleaner than having to run the power cords through the rack to get to the back where the outlets probably reside.

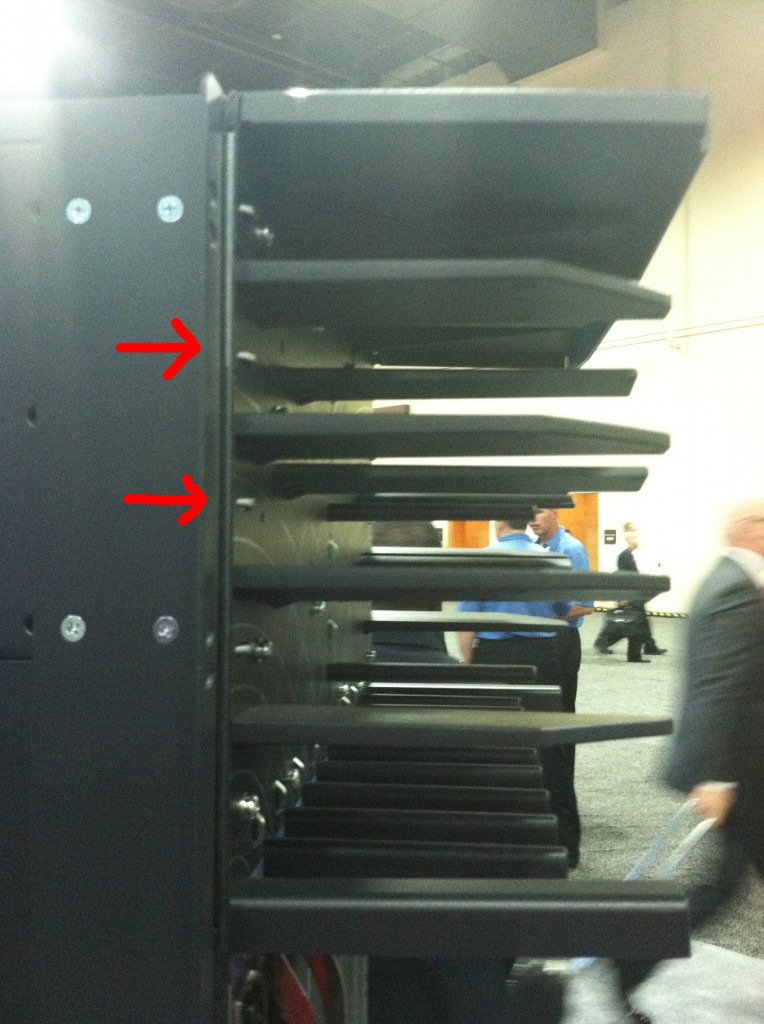
12910 Cable Management

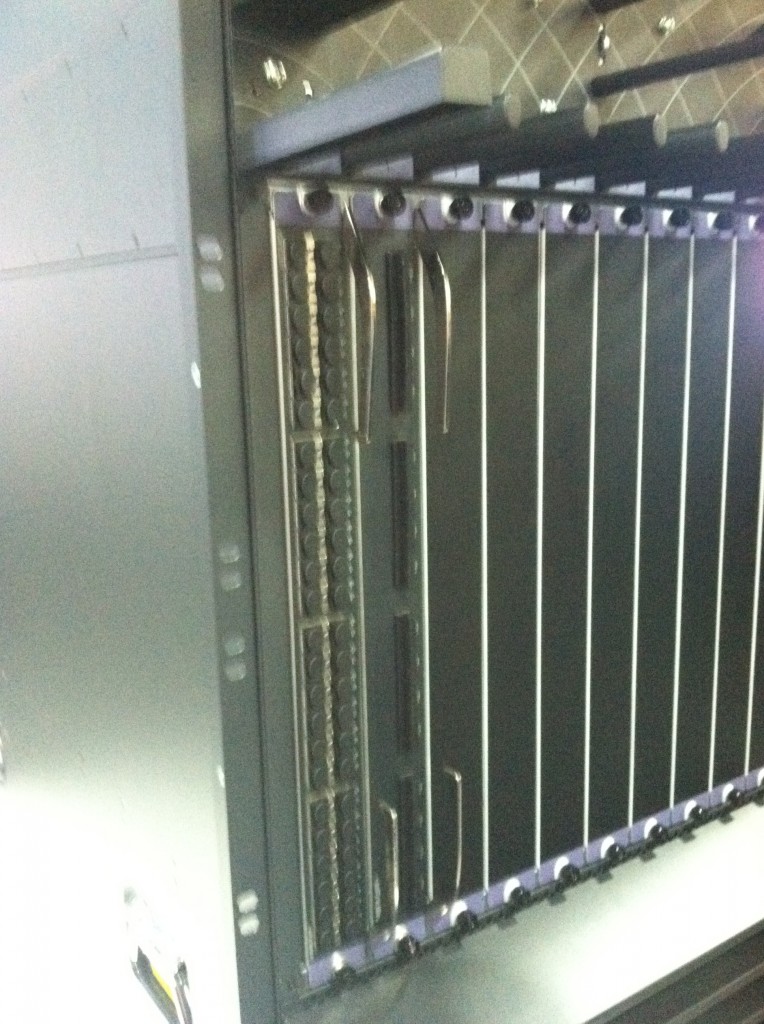
Those red arrows are pointing to little metal loops that I believe are meant for securing fiber and copper cables to the chassis to keep them neat and orderly. The problem as I see it are that they are just big enough for plastic tie wraps, but too small to use velcro strips. I absolutely hate using plastic tie wraps on cabling in data centers unless they are used on the back of patch panels to bundle fixed drops going to wall outlets or another patch panel. I’ve just seen too many fiber and even copper cables get ruined when you have to add an additional cable to the bundle or remove one. If there is enough slack in the tie wrap to cut it with a pair of snips or scissors, then it isn’t too bad. Unfortunately, people tend to tighten them up to where you can’t easily cut it without damaging the cables they are wrapped around. Perhaps there are tiny velcro straps I am not aware of, or these loops have a different purpose.

*** Update – Tony Mattke pointed out in the comments that they do make 1/4″ velcro tie wraps, so I was wrong in my comments above.

12910 Line CardHere is a shot of what I believe are 10Gig and 40Gig line cards. The metal levers that secure the line cards into place are offset enough from the card that you can effectively remove a cable from the ports closest to the levers without wanting to scream obscenities at the line card.

12910 Rear ViewA complete view of the backside. Let’s take a closer look at it.

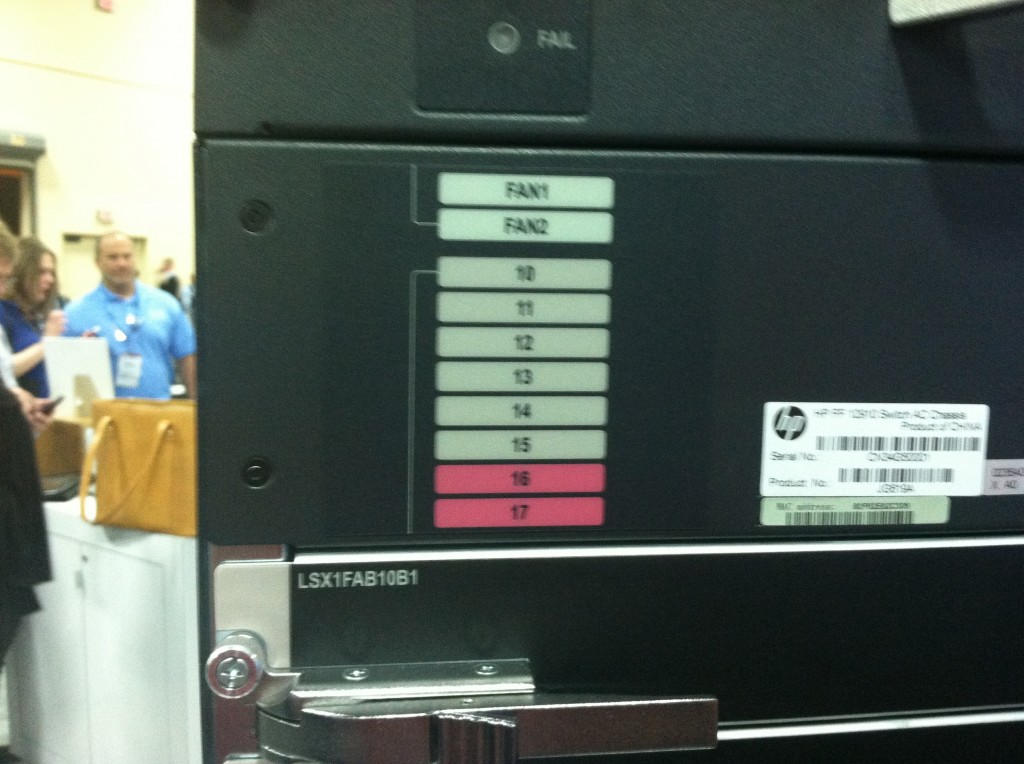
12910 Rear MapI thought this rear chassis map was a nice touch. The fan trays, fabric modules, and supervisor slots in red are marked so the odds of someone putting a supervisor in a fabric slot or vice versa are minimized. Yes, that could happen.

12910 Fabric-Sup ViewHere are the six fabric modules. They are pretty big compared to fabric modules in some of the competing switches from other vendors.

12910 Sup Up CloseA close up of the supervisor modules. Notice they are color coded to match the map shown in a previous picture. The easier you make it on the customer, the better. 🙂

12910 Fan TraysFinally, the 2 fan trays. They are also pretty big!

Some Technical Details

You can look at the spec sheet here. A few things worth noting:

1. This switch is Openflow 1.3 capable.

2. It has 23Tbps capability.

3. It supports TRILL and SPB.

4. It will support Multitenant Device Context in 2014, which I would compare to Cisco’s Virtual Device Context. This allows you to segment this physical chassis into 4 distinct logical switches for multi-tenancy or to separate functions like WAN aggregation from LAN aggregation.

5. Plenty of 10Gbps ports (480), 40Gbps ports (160), and will eventually(Q1 2014) support 32 100Gbps ports. I suspect the 40Gbps and 100Gbps density will increase with newer fabric modules in the future.

6. It will support Ethernet Virtual Interconnect in 2014 which allows you to extend layer 2 across a total of 8 different data centers. This would be similar to what Cisco does with Overlay Transport Virtualization on the Nexus and ASR platforms. It runs over any layer 3 connection, so as long as you can route using IP, it will work. This is great for things like vMotion.

Closing Thoughts

Much like the Cisco Nexus 7000 family, Brocade VDX 8770, and other large switches, the HP 12910 isn’t for everyone. It’s meant to move large amounts of traffic across data center networks. Most customers out there don’t need this kind of power. However, for those that do, this switch gives you a ton of throughput with some interesting features. More information on this platform should be coming as it is rolled out to production networks around the world. I just wanted to share some pictures and thoughts around this new platform.

Disclaimer: HP paid for my travel and accommodations at Interop Las Vegas 2013. I was not asked to write anything about them in return and received no compensation for my time spent with them at this or any other event they sent me to.


Posted in data center, hp, switching | 3 Comments

Lacuna Systems

LacunaLogo

I had the pleasure of speaking with the people from Lacuna Systems at Interop a few weeks ago. I wasn’t familiar with them at all, and since they happened to have a booth on the expo floor, I was able to meet up with them and talk about their Indico platform. I’ve used a few APM(application performance management) solutions, so I am a little familiar with the space. However, Lacuna Systems is doing something a little different. Before I mention what that is, allow me to point out a few negative things regarding some of the APM implementations out there.

Cons of APM

1. Can be extremely difficult to implement. – Some APM implementations take months and many engineers to get up and running.
2. Can be extremely difficult to use. – Some APM products have so many nerd knobs that you can get lost in the sheer amount of options. If you don’t have a dedicated monitoring engineer, your APM solution might become a really expensive tool that is never used by anyone.
3. Software agents. – Installing software agents on a bunch of servers can become problematic. The agents have to be updated on occasion, and depending on how they are implemented, they can cause stability issues.
4. Interface monitoring. – It is fairly common to have to mirror all traffic coming in and out of chokepoint interfaces(physical or logical) and relay that to the APM system. Quite often, the APM system itself does not have the number of interfaces needed to aggregate all this data and you have to buy a really expensive network tap solution(eg Gigamon or Anue/Ixia). You can also potentially use up the limited number of monitoring sessions available on your hardware platforms and have to make hard decisions as to which of your monitoring platforms is more important.

Not every APM solution out there has all of the problems listed above. Some have only one or two and others don’t have any of those problems. How is Lacuna Systems different? It’s quite simple. They are only watching your load balancers, or ADC’s, for those of you who refuse to use the term load balancer.

Why Load Balancers?

How many data centers do you walk into these days that DON’T have some sort of load balancer in production? Not many, unless you are dealing with smaller environments. The traffic that flows through a load balancer is probably pretty important to an organization. Any revenue generating applications are probably sitting behind one or more load balancers. You’d want redundant servers at each tier to ensure constant availability. The easiest way to do that is with a load balancer.

Considering the traffic flowing through a load balancer is pretty important, why not focus your monitoring efforts on that traffic? That’s what Lacuna Systems does. You might think that they are missing out on a lot of other stuff in the network by only watching the load balancers. They would agree with you because they are also not trying to be all things to all people. What they are betting on is that the bulk of the information you care about from an APM perspective, is flowing through your load balancers.

How Does It Work?

Simple. They use the built in API’s from each load balancer to get the monitoring information. No network taps or port spans are needed. No remote agents on servers. None of that. They basically just need login information to your load balancer and then they can pull all the data out that they need for monitoring purposes. The Indico platform will take in all of this data and automatically build a baseline of your traffic. When there are deviations down the road, alerts get sent. I’d like to say that there is more to it than that, but that is basically how it works.

If you add new members to a load balancing pool or create new virtual IP’s on a load balancer, the Indico platform automatically detects them. You don’t have to manually update the system every time a change is made to a  particular load balancer that is being monitored by Indico.

How Can I Use It?

Today, Lacuna Systems is focusing on F5, Citrix, and A10. However, that doesn’t mean those are the ONLY vendors they will support. I asked them about future plans to support other vendors, and they told me that they’ll support whichever vendor they need to based on customer demand. Obviously, the vendors they support will also have to allow API access. Otherwise, you are looking at screen scrapes off a GUI session, which is messy trying to convert it to text, or using CLI to get data and then parsing it into a usable format.

Think beyond monitoring though. What if you could provision things for multiple load balancers from a central location? What if you were able to do this for load balancers from multiple vendors all at once? That’s where I see an additional use case with Indico. Granted, you can do that apart from Indico just by using the API’s, but since Indico is able to talk to multiple vendors, if you happen to use a variety of load balancers, it might make sense to push those changes through the Indico platform. Maybe that is something they could bake into the product down the road. Of course, customers would probably have to ask for that feature first.

More Info

Here’s a quick 15 minute video from Robert Scoble and Rackspace where Derek Andree from Lacuna Systems is interviewed about the Indico platform. It is a nice summary of the overall solution.

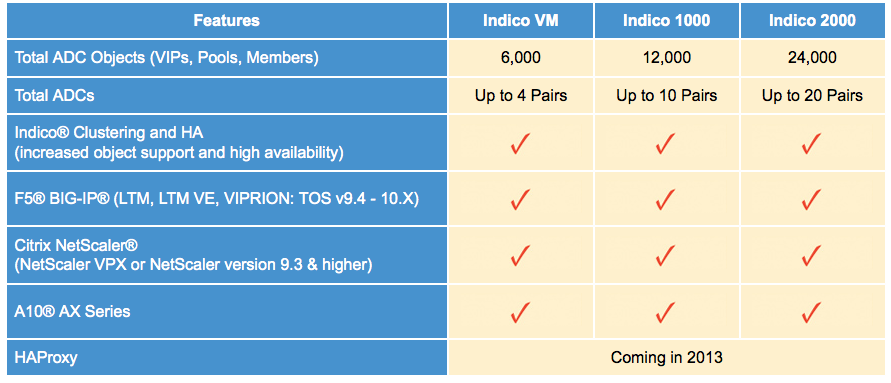
Just to give you a general idea of what their platforms can monitor, here are the numbers for the virtual and 2 physical appliances(Dell servers):

Indico Specs

More information is found here: https://lacunasystems.com/products.php

Closing Thoughts

There are a lot of players in the APM space. Most of them are very expensive. Depending on your needs, you may not need all of the bells and whistles that the larger APM players provide. Maybe you just need to know how your core applications are performing. If they happen to flow through a load balancer, Lacuna Systems just might be a vendor that can meet your needs. They also don’t require you to mirror your network traffic into another device for monitoring purposes since they are using API’s.

All in all, I thought it was an interesting way to monitor applications. You can check them out at www.lacunasystems.com.
Posted in data center, lacunasystems, load balancing, monitoring, network management, vendors | Comments Off on Lacuna Systems

In Search Of Swag

Just when you think you have all the vendor swag you could want, and more, someone else comes along that makes your collection look pathetic. Courtesy of Josh Atwell, I give you “The Brad”:

Posted in humor | Comments Off on In Search Of Swag

The Curse Of Matthew’s Books

Now I know what you are thinking. That’s an odd title. You might think this is about me, but it isn’t. It’s about another fella named Matthew. Perhaps the word “curse” is a bit extreme, but please allow me to explain.

There’s this guy I know. He works for Aerohive and works with the 802.11 working group. His name is Matthew Gast, and he writes books that make me lose sleep in search of further understanding. You may know him from the 802.11 Wireless Networks book and maybe even the more recent 802.11n: A Survival Guide book. That isn’t where I know him from. The first book of his that I read was this one:

T1 Book Cover


In case you aren’t familiar with this book, your eyes are not deceiving you. That is a book on T1 circuits and it drove me insane for a brief period. Several years ago I was reading every technical book I could get my hands on in terms of networking. I had a subscription to Safari Books Online and I was plowing through title after title at rapid pace. Lunch hours, late nights, and weekends were spent absorbing as much as I could because I couldn’t stand the thought of not knowing about everything there was to know about networking. I was working a job where there were literally hundreds of T-1 circuits spread out across a nationwide network. Any additional information I could use in regards to those circuits would be beneficial and I would be able to converse with the service providers more on their level, which would help reduce the time spent troubleshooting.

And so it was that I summoned the powers of my Safari membership and began to read an entire book on the T1. My mind was exposed to things I was somewhat familiar with. Line coding and framing modes were terms I was used to muttering when asked about how the circuit was configured. B8ZS and ESF were the stock answer, but what did they really mean? That book on the T1 exposed me to the meat and potatoes of B8ZS and ESF. I could see the 1’s and 0’s clearly. I suddenly knew how circuit alarms were generated. I was able to comprehend why the serial interface on a router showed a bandwidth of 1536kbps instead of 1544kbps for a T1. It all made sense. So much sense that I went off the deep end.

I became obsessed with Extended Superframe. I wanted to read binary and find the framing bits vs the standard channel data. In turn, I became obsessed with the Ethernet frame as well. Reading raw hex in Wireshark, I would try to see where the Ethernet header was, the IP header, TCP header, etc. It was a wild and informative ride, but I finally had to come to the conclusion that nobody really cared about that stuff. You couldn’t talk to people about it because they just didn’t feel the need to know that level of detail. It’s one thing to talk about something like BGP in great detail. There are plenty of people that will gladly engage you in those kinds of discussions. It is a completely different kind of party where people want to discuss the finer points of B8ZS vs AMI or why ESF yields 1.544Mbps when you add all the 1’s and 0’s up. The ONLY people that are probably even remotely interested in that stuff are voice engineers. Even then, apart from understanding sampling rates, and why a DS0 is 64kbps, they probably don’t care about the rest.

I put that period of insanity behind me. I swore off the urge to obsess over the finer points of technology and wanted to just be a decent all-around network guy. The following years were full of routing, switching, wireless, load balancing, WAN optimization, monitoring, firewalls, and any other type of networking to be had. Nothing too crazy and nothing too deep.

Fast forward a few years and I had read a few more of Matthew’s books:802-11WirelessNetworks


802-11n


And then, about a month ago, I got my hands on an early release copy of his new book:

802-11ac


I read the entire thing, and for some reason, I had another “T1 episode”.

I’m currently on week 2 of layer 1 obsession as it relates to WiFi. Suddenly, I don’t feel competent in the realm of wireless until I can whiteboard every little thing that happens when the energy leaves the antenna on the AP and makes its way to the client or vice versa, and I am not even concerned with the higher layers yet. I find myself watching anything on YouTube that even remotely resembles RF fundamentals. I’ve got several books from different publishers on wireless communications that I have been skimming through, but I still want to know more. What I want is what I cannot have and that is to be able to see those little wireless waves travel through the air. I want to see that phase shift. I want to see the amplitude adjustment happen in a split second and be able to map a point on a  constellation diagram and know that the little dot that I just mapped is the binary equivalent of 01100101. Of course, that might be asking too much and how many customers would even be interested in that level of detail? It would probably weird them out if you started spouting off binary strings like you had a bad case of Tourette’s syndrome.

I hope Matthew’s next book will be a picture book. That would make it easier on me. 🙂

Posted in learning | 1 Comment

VAR&D

I had an interesting discussion with a client a few days ago that was centered around code levels on devices. We’re updating some code on a pair of Nexus 7010’s in a few weeks and we spent some time poring over the release notes, upgrade/downgrade procedures, and known bugs as it relates to the code version we are moving to. We are also going over to the local Cisco office to use their lab gear to verify these procedures and that the code bump won’t break anything.

That led to a broader discussion around how we in the VAR world can verify that all the moving pieces work together and all potential problems are identified before any implementation or upgrade. This particular engineer had just come from a much larger environment where he had Spirent testing gear and plenty of spare hardware to test things before deployment. His contention was that you could really add more to the “value added” part of VAR if you could offer additional assurance around deployments and upgrades.

What Usually Happens?

If a client needs to upgrade their code on certain hardware, they typically have to rely on release notes and upgrade instructions from the vendor. Maybe there is a known bug list available for the version they are upgrading to. Maybe not. It depends on the vendor. They also might just update the code after the first update beyond the major release has been released. For example, platform X gets upgraded to ver 2.1 since it is the first update since ver 2.0. I’ve been in quite a few environments where the rule of thumb was not to upgrade any software until the first service pack or major patch had been released.

No matter the approach you take from the above choices, you are taking a risk that all will go well. If you are a large enough organization, or possibly tech focused, you might have a lab that has the same hardware as your production network. If so, you can actually do comprehensive testing, provided you actually have time to get that done. After all, you have meetings and conference calls to sit through right?

Current Testing State

From my sloppy and lazy research, which consisted of asking a question or two on Twitter and also reflecting on past experiences, I was able to determine a few things:

1) Vendors do extensive testing on their products. This may sometimes include other vendor hardware, but will probably not encompass anything more than the most common scenarios.

2) VARs will do testing on a case by case basis, but only the big ones are going to have the right gear to do that.

3) If you REALLY need to make sure, and you are a good enough customer, you can go out to a customer proof of concept center run by the vendor whose gear you are using and they can test various scenarios for you.

4) Just do the upgrade, call support if it breaks, and let the vendors slug it out with each other. After all, that’s why you pay them for maintenance and support.

What Could Happen?

Imagine a world where you could go to a VAR and ask them about potential problems with a code upgrade or a multi-vendor implementation project and they could tell you what you could realistically expect. I’m not talking about the “we’ve done this before and never had a major problem”. I’m talking about them being able to take your present network state and future network state and give you some concrete information around what your experience will be post-upgrade.

My initial thoughts were that a VAR could sink a pile of money into a lot of lab gear and start building out various tests and have engineers break things and fix them. Of course, that means those engineers aren’t out getting those ever so important services dollars from post-sales efforts, or they aren’t smooth-talking customers over fancy meals during pre-sales engagements. You have to be willing to take the loss on the testing engineers with the hope that you make the cost of their salaries back in fees from clients.

The particular client who filled me with this idea suggested that it might be better for a company to do this testing and then sell that information to VARs in some type of package deal. Perhaps along the lines of a subscription service similar to what a company may do with Gartner to gain access to their reports and analysts.

Plausible Scenario?

Customer ABC goes to VAR XYZ to get some advice on a planned code upgrade of their distribution switches. These switches run OSPF and have neighbor relationships with their firewalls as well as some routers. The switches, firewalls, and routers are from different manufacturers. Customer ABC just wants to make sure they can perform the upgrade without their network exploding. VAR XYZ has consulted the testing company, and they are able to provide them with information regarding those particular products and the code levels they are running and are going to run after the upgrade. VAR XYZ then passes this information along to the customer, who decides whether or not to proceed based on the test results.

Closing Thoughts

Is that a realistic endeavor? Could it be done and have credibility? I think so, provided there is no money coming from vendors. That just ruins it in terms of credibility. That isn’t to say that you can’t extract value from vendor sponsored tests. You can, but you must take that with a grain of salt.

Of course, any type of company doing the testing would require about a billion pages of legal mumbo jumbo to avoid getting sued. They would also have to have some pretty precise testing methodologies to ensure valid results. There’s also the issue of not being able to test every possible scenario and pre-package the results. You could develop the most popular configurations over time and test one-offs when requested.

What do you think about something like this being a reality in the IT industry? Would companies pay for that kind of data or is this not realistic?

Posted in selling, testing, vendors | 6 Comments

Recovering Your Wireless Pre-Shared Key On An Apple MacBook

This might not be anything new to some of you Mac veterans, but I stumbled across this the other day and felt compelled to share it.

If you are like me, you connect to a wide variety of wireless networks. Sometimes, you need to share the pre-shared key to a particular network, but don’t remember what it was. Your laptop just automatically connects to it without prompting you. There is a way to see what password is used for each wireless network you connect to using a pre-shared key for authorization. Using the following steps, you can recover the actual password used:

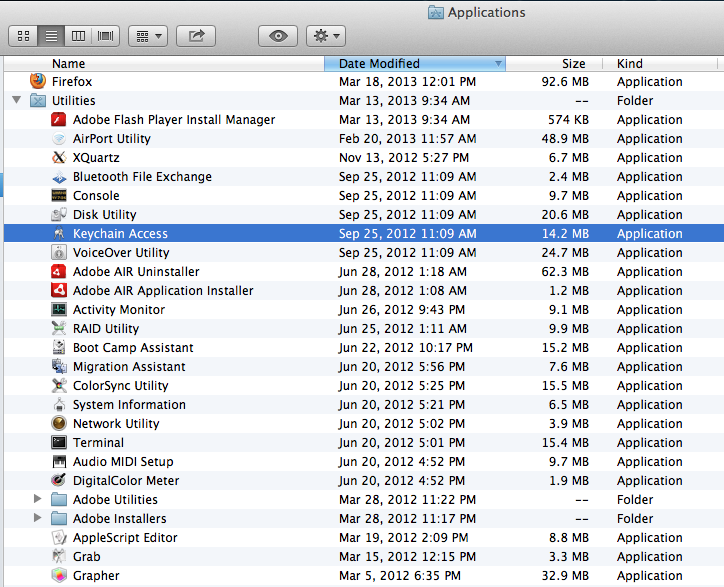
1. Open the “Keychain Access” program under one of the following methods:

A) Select”Applications” and then “Utilities”:

KeychainAccess-4

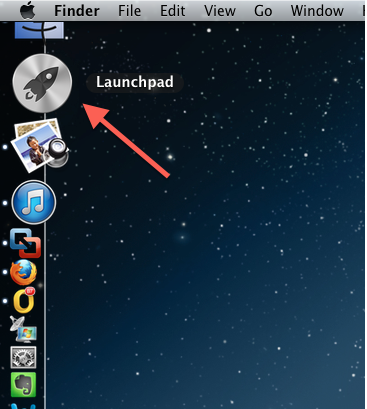
B) Select “Launchpad” from the dock, followed by “Other” and then “Keychain Access”.

KeychainAccess-1 KeychainAccess-2KeychainAccess-3

***Note – I realize there are other ways to get to the Keychain Access program via the CLI and GUI. I chose the 2 methods that I thought were easiest to find.

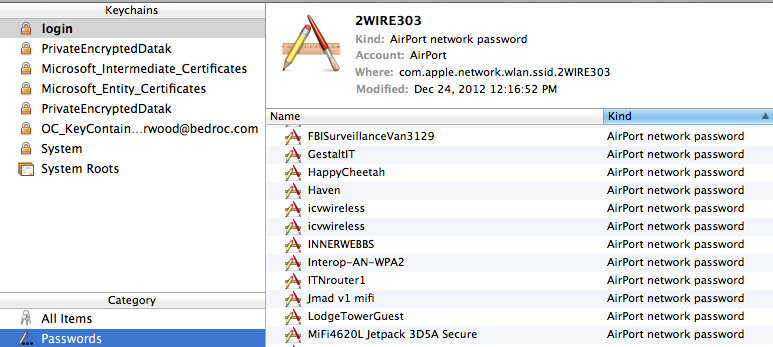
2. Once the “Keychain Access” program opens, select the “login” keychain, and then select “Passwords” under the category section on the bottom left of the window.

Screen Shot 2013-03-25 at 12.29.57 AM
3. Select the network you want to recover the pre-shared key from and either double-click it, or select it and hit return/enter.

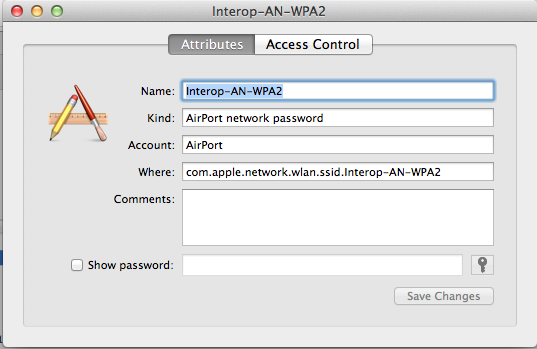
4. The next screen you see, should look like this:

Screen Shot 2013-03-25 at 12.33.20 AM

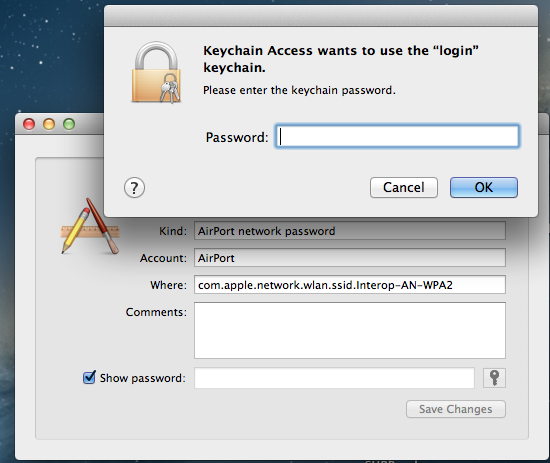
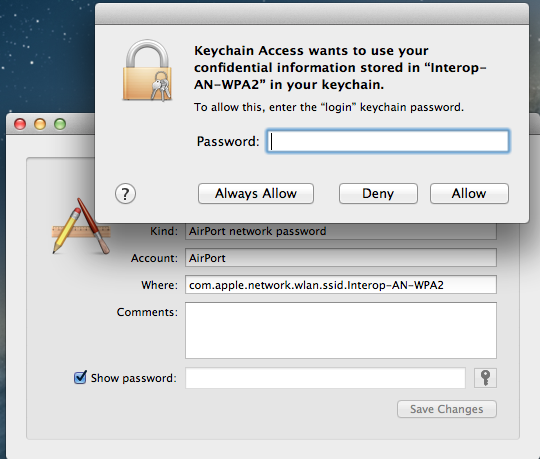
5. Check the “Show password:” box, and you should get prompted for additional access. This will look like the following 2 windows. It might only be a single window that prompts you. In any case, enter your account password you use to login to your Mac or the password you use for sudo/root access.

Screen Shot 2013-03-25 at 12.33.40 AM Screen Shot 2013-03-25 at 12.34.00 AM

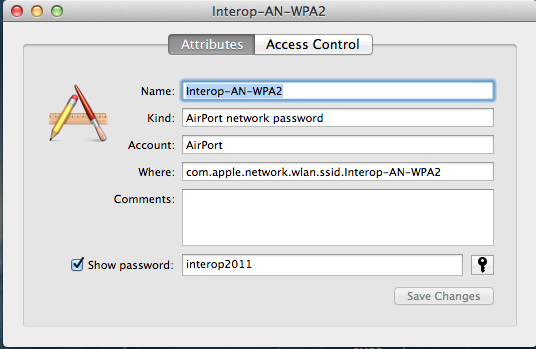
6. After successfully authenticating with your account password, you should see the plain text password in the “Show password:” field.

Screen Shot 2013-03-25 at 12.34.14 AM

That’s all there is to it! Now you can share the PSK with another device or person.

Posted in troubleshooting, wireless | Comments Off on Recovering Your Wireless Pre-Shared Key On An Apple MacBook

Aerohive’s Latest Product Release

Aerohive LogoThis is going to sound bad, but I don’t really care that Aerohive announced new switches. I thought I did. I knew they were coming and I longed for the day they would be here, but then they showed up, and my enthusiasm quickly waned.

I changed my mind though. I stopped thinking about it from an enterprise or large business perspective and started to think about it from a mid-market or SMB perspective. Then, it started to make sense and I started to get excited once again. Like a hormone raging teenager with bi-polar tendencies and no medication, I went from happiness, to dismay, and back to happiness.

What’s The Big Deal?

The fact that a wireless company just announced switches should not be earth shattering news. Aruba did it some time ago. Meraki did as well. Cisco and HP have always had them, but they do so much more than wireless, so it is hard to count them in that group.

I thought it was interesting when Meraki announced their switches, but that was because they were cloud managed, unlike Aruba’s switches. It had nothing to do with the hardware itself. Most access switches are boring. 24 or 48 ports of 10/100/1000 with some or all being PoE or PoE+. It doesn’t quite have the pull with the masses that it used to.

For larger networks, cloud managed switches aren’t a big deal. For smaller companies with distributed environments, it is a big deal.

Why Is It A Big Deal?

My sister has an Aerohive access point in her house. Nothing fancy. An older AP 110 model, so she can either run 5GHz or 2.4GHz, but not both at the same time. She had a smaller Netgear unit before switching to Aerohive, but that AP was not getting the job done. I gave the AP to my brother-in-law and told him to just plug it in to their Internet connection at home. I would do the rest without coming by their house. My sister texted me a day or two later while I was at home sitting on the couch and I remotely configured her AP, texted her the SSID and PSK and that was it. Later on, she had issues on 2.4GHz due to interference from the surrounding neighbors, so I switched her over to 5GHz, since all she needed was connectivity for her iPad. Problem solved, and I didn’t have to do more than about 10-15 minutes of work. I even used the remote spectrum analysis tool to figure out what was happening on the 2.4GHz band prior to shifting her to 5GHz.

Imagine that on a larger scale. What if I had a dozen locations that needed a single AP or a few AP’s? Using a cloud based management platform like Aerohive’s HiveManager Online(HMOL) means I don’t really have to even touch hardware before it gets sent to whatever location it will be operating at. As long as there is an Internet connection, I will be able to access that hardware remotely.

That’s great for wireless AP’s, but what about the other gear? My remote locations probably have a router and a switch. It is fairly common for the service provider to take care of the router for companies with little or no IT staff. It is one less thing they have to worry about. With Aerohive announcing switches, that run the HiveOS code that the AP’s do, guess what I am also able to do? You guessed it. Deploy switches without necessarily having to pre-configure them. All the interesting things I did on the AP’s from a security perspective, I can now do on the switch side. That may not seem like a big deal, but remember that in the mid-market or SMB space, this will help out tremendously.

In short, this is about time and resources. I don’t have to spend a lot of time staging equipment before sending it out via FedEx/UPS. I can ship it direct to the site and then remotely configure the gear. I also have the ability to monitor everything through HMOL. No separate management systems for wired and wireless. You can get this functionality with Cisco, HP, and Aruba, but it isn’t going to be as trouble-free and it will most likely cost a lot more. The one exception to Cisco being that they now own Meraki, and Meraki has switches and AP’s that are managed via the Internet in a similar manner to Aerohive’s HMOL platform. I can get similar functionality to what the larger networks are getting with their management/monitoring systems.

But Wait. There’s More!

It doesn’t end with the switches though. Aerohive has also announced Application Visibility and Control(AVC). If you follow the networking space, you know this has been a big deal for several years. On the firewall side, Palo Alto came out swinging a few years ago with a firewall that could peer into the network traffic and determine what applications were in use and let you filter based on that. You want to block Netflix? No problem. Want to allow Facebook timeline, but no games like Farmville? No problem.

Other vendors followed suit and released their own application aware capabilities. For all I know, they were working on it long before Palo Alto. Doesn’t really matter. Cisco, Juniper, Checkpoint, Palo Alto, and others have application visibility baked into their firewalls now. The wireless industry followed suit. First, it was Meraki. Then, Aruba and Cisco came out with their own application visibility solution. Now, Aerohive has announced theirs.

I could mention a bit about Aerohive’s AVC solution, but I would rather you just read my friend Chris’ post instead. I’ll simply add that AVC gives smaller customers insight that the larger ones probably already have. It levels the playing field. Expect to see more information about this in the near future from others.

Here are a few articles about this announcement from others:

Aerohive Is Switching Things Up – The Networking Nerd

Aerohive Launches Cloud Managed Switches – Lee Badman


Posted in aerohive, wireless | 1 Comment

Getting Your Money’s Worth Out Of Your Links

bro_wing-r_1c-red_pos_rgbI was fortunate enough to attend the Brocade Analyst and Technology Day event back in September at their corporate headquarters in California. I have a dual interest in Brocade as I follow them from a general technology perspective and I also happen to work for a Brocade reseller.

This event was centered around the data center and the main attraction, at least for me, was the unveiling of the 8770 VDX switch. This was a big addition to their already flourishing VDX line of switches. They discussed some other things during that event like their involvement with OpenStack as well as the advantages of using their ADX line of ADC’s/load balancers.

Another Switch?

Yes. Another switch. Not just any switch though. This is not old Foundry gear or old technology. This is a platform that has been built with the future in mind. I say that for a few reasons.

1. Each slot has up to 4Tbps capacity.
2. 8 slots for power supplies at 3000W each. You don’t need more than 3 to power the switch today.
3. 100Gig ready.
4. 3.6 microseconds any-to-any port latency.

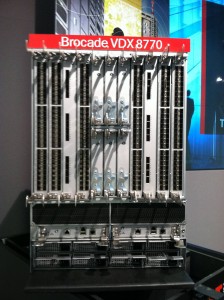
I took a few pictures of this switch. It looks very heavy. I poked and prodded it without actually pulling line cards out and it seemed pretty sturdy. Every knob or lever seemed to be durable metal.

8770_Front_View8770_Rear_Fans


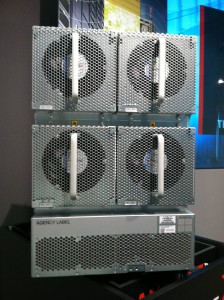
Of particular note are the humongous fans on the back of the chassis.

8770-Intake-CloseUp


Here is a close up of the intake slot on the front. Hard to believe this little guy sucks in all the cold air.

8770-PowerSupplies


This chassis can support up to 8 3000W power supplies. You won’t need 8 of them for years to come. However, the capability is there so that the chassis can be used as the line cards get upgraded in the future.

8770_Fabric_Modules


A close up shot of all 6 fabric modules.

Okay, so that isn’t impressing you is it? If you want more speeds and feeds regarding the 8770 VDX platform, read Greg Ferro’s post here. He also has some pictures. In fact, you can see me in the front of the switch, gut and all, taking my pictures while he was taking the picture of the fans in the back.

But Wait! There’s more…….

There was one feature on the 8770 that I thought was extremely interesting. Load balancing across multiple inter-switch links on a per frame basis.

Before I go into more detail on that, allow me to explain how load balancing across multiple links typically works. I’m aware that different vendors use different terms. You’ll see me do the same. No matter the term being used, we are talking about aggregating multiple physical links connecting switches to each other into a single logical interface.

Link Balancing Basics

Traffic is balanced across redundant or bonded inter-switch links using a few different criteria, but the major ones I am aware of are the following:

Source MAC Address
Destination MAC Address
Source IP Address
Destination IP Address
Source TCP/UDP Port
Destination TCP/UDP Port

This will vary according to the vendor and intelligence of the platform. Some switches might only support source/dest MAC address to determine which link to use. One thing should stand out with the above list though. The link chosen is going to be flow based. The more unique you can get, the better. That probably means you are going to favor using the TCP/UDP ports if your switch supports it.

Considering that an entire flow goes across a single link, you can see how this could result in uneven load. A 4 link bond between 2 switches could result in 1 link getting high usage while the other 3 links have much less traffic on them. In reality, if you were to logically group 4 x 10Gbps interfaces together, you wouldn’t have a single true 40Gbps interface. You would have 4 x 10Gbps interfaces that are 1 logical interface and can failover to each other should a link go down.

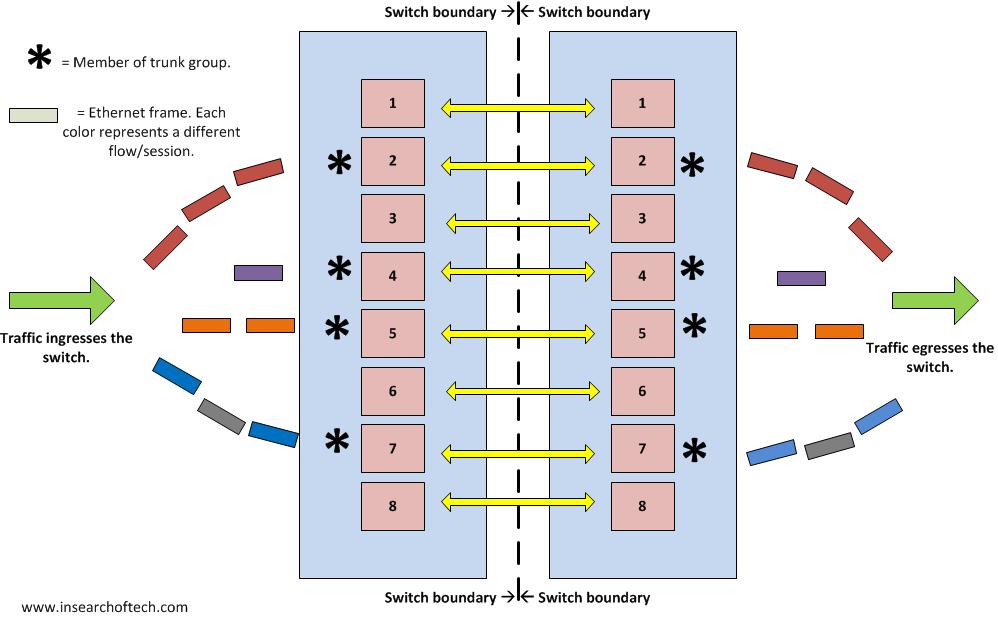
Reference the drawing below. I used the term “trunk group” to represent the logical interface created by combining 2 or more physical links together. That’s the term Brocade uses. For Cisco enthusiasts, that would be a port-channel interface.  4 x 10Gbps interfaces are bonded together using LACP or some other mechanism to present themselves as a single logical interface. The various colored rectangles coming into the switch represent individual flows. Notice the red flow going into port 2 while the purple and orange flows go into ports 4 and 5. If each rectangle is a single Ethernet frame, then you can see the imbalance. In the case of port 7, it has 2 different flows going across. This is a very basic representation of link balancing, but it should give you the general idea. If you want more info on this from a Cisco switch perspective, read Ethan Banks’ post from 2010 here.

Standard Link Balancing

A Better Way

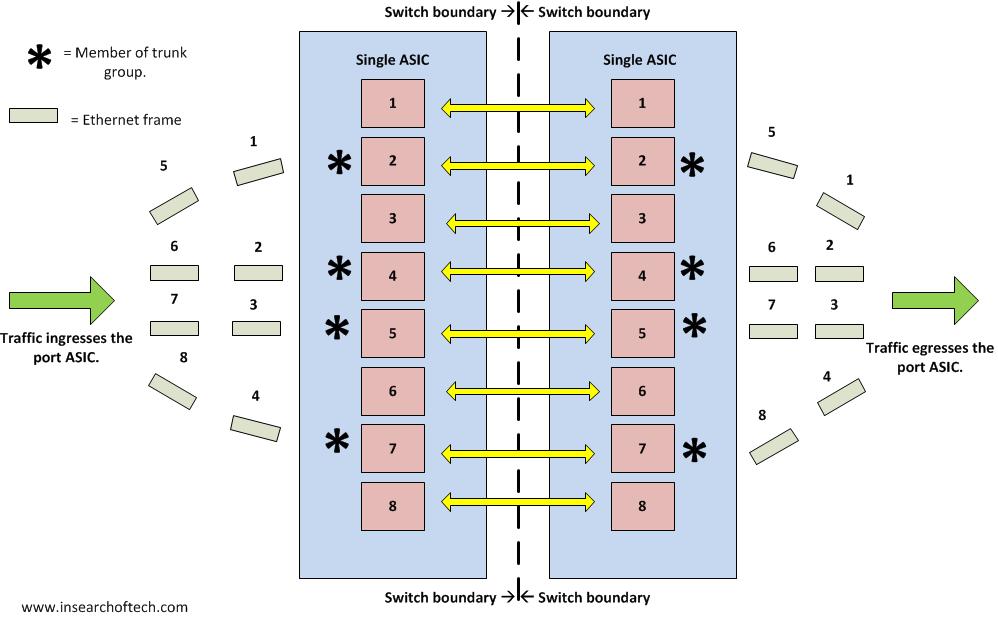
The neatest thing I saw regarding the 8770 was the layer 1 link bonding. That’s right. Using layer 1 to merge links together. They called it “frame spraying”, although it is referenced in a slide deck from the event as “frame striping”. In any event, they are able to balance traffic across all ports in a trunk group on a per frame basis. That’s as close as you are going to get to ideal load balancing. You don’t have to modify a hashing algorithm to make this happen. It does it automatically. The only caveat is that all ports in the trunk group have to be tied to the same port ASIC and it is limited to 8 ports in a trunk group. Using 10Gig interfaces, that’s an 80Gbps trunk group that can exist between two 8770’s. I should point out that this existed prior to the 8770. I just wasn’t paying close enough attention to it until the 8770.

The diagram below shows traffic flow when using Brocade’s frame spraying technology. In this example, I used 4 x 10Gbps interfaces to make 1 logical 40Gbps connection between 2 switches. You can see that each frame is sent across the 4 links in a round robin fashion.

FrameSpray

How Does It Work?

Unfortunately, I have to speculate on how they are doing this. Brocade won’t actually tell you. Not that there aren’t hints of course. Ivan Pepelnjak wondered the same thing and mentioned in his post about Brocade’s VCS fabric load balancing that the answer lies in the patents. Brocade is already doing something similar to this in their Fibre Channel hardware, so naturally it was easy for them to just port it over to the Ethernet side of things.

I read through several of those patents. All I got was a headache and more confusion. It was better than reading RFCs though. I still don’t know for sure how it works, but I am going to take a guess.

The fact that all members of the trunk group have to be tied to the same ASIC should help us speculate as to what is going on. My guess is that some sort of low level probe or primitive goes out each port. The neighbor switch is doing the same thing. When these probes are received, the ASICs can very quickly figure out which ports are talking to the same ASIC on the other end. Some sort of tag might be used saying: “I am port X, tied to ASIC X, and tied to switch X.” I would probably compare this to a lower level form of LLDP, FDP, or CDP. I could be COMPLETELY wrong on this, but we’ll never really know unless someone can find the hidden method by reading a bunch of patents or Brocade decides to publish the method themselves.

Closing Thoughts

I could have focused on other things that I saw at the Brocade tech day event, but chose to focus on the “frame spray” feature instead due to the “neat” factor of it. This has significant real world application. I was recently involved in a network congestion issue around FCoE performance. The fix action was to change the algorithm that the switch used for load balancing across bonded links to another switch from the default source-destination MAC to the more granular TCP/UDP port. Performance increased dramatically after that change. Imagine if that wasn’t an issue at all and near perfect load balancing was occurring? With Brocade’s VCS technology, which is a part of their VDX line of switches, you don’t have to worry about it as long as you plan out your physical connections properly.

Here are a few posts from others who were at the Brocade event with me:

Brocade Tech Day – Data Centers Made SimpleTom Hollingsworth

Much Ado About Something: Brocade’s Tech DayJoe Onisick

Brocade’s Data Centre Ethernet StrategyGreg Ferro

Posted in brocade, data center, load balancing, switching | Comments Off on Getting Your Money’s Worth Out Of Your Links